New JVM options and Scala iteration performance Monday, Oct 26 2009 

Internal iterators like foreach tend to do very well in micro-benchmarks on the JVM. In fact, they often do as well as the equivalent manual while or for loop. There is a catch, however, and it’s easy to miss it in micro-benchmarks.

A few months ago, David MacIver forwarded an email from Martin Odersky to the scala-internals mailing list about this. The problem as described by Martin:

“The reason seems to be that the foreach itself is not inlined, so the call to the closure becomes megamorphic and therefore slow.”

I was curious about the benchmarks used to measure this and Tiark Rompf (who had performed the measurements) provided the source code. I said I’d try to take a look the next weekend and I did it… more than 3 months later. Well, better late than never. ;)

There are 3 benchmarks:

  • Benchmark A: traverse a collection with N elements
  • Benchmark B: traverse a collection with N elements, inside the loop/closure traverse another collection with N2 elements 3 times
  • Benchmark C: build a collection (front to back) of N elements

Various approaches are used for each benchmark with various collections types. One weakness of the these benchmarks is that they don’t include a verification mechanism to ensure that all benchmarks produce the same result. However, they include code that tries to prevent the JIT from performing unfair optimisations (e.g. print something if an element in the collection matches a certain condition).

The original results produced by Tiark can be found here.

I added a few benchmarks that use plain arrays (RawArrayIndexed, RawArrayForeach, RawArrayForeachMega), made minor changes to the scripts and pushed the code to a GitHub repository. I left the rest of the Scala code as it was to make it easy to compare with the original results and ran the benchmark with various JVM settings to see what effect they would have. All the tests shared the following:

  • Dual quad-core Xeon E5462 2.80GHz
  • 14 GB RAM
  • Fedora 11
  • Scala 2.8.0.r19261
  • Revision 59521431f5c118b73e35b0b396e3efd6aecec3dd of project
  • 64-bit JDK 6 Update 18 early access b03
  • JVM base settings: -Xms1G -Xmx1G -XX:+UseParallelGC -XX:+UseParallelOldGC

JDK 6 Update 18 is scheduled to be released on Q4, 2009 and it includes HotSpot 16. Even though JDK 6 Update 14 (HotSpot 14) introduced compressed references and scalar replacement, HotSpot 16 includes improved compressed references and many crucial fixes to both features. According to my testing these features are now approaching production-level stability and the OpenJDK engineers seem to agree as they are both enabled by default in HotSpot 17 (which will eventually hit JDK6 too).

Interested in how these features would affect the performance in these benchmarks, I ran them with various combinations. I also added Scala’s compiler -optimise flag in some cases.

The original benchmark from Tiark used 3 collection types: array (java.util.ArrayList), list (scala.List, immutable single linked list) and vector (earlier version of immutable vector that has recently been added to Scala 2.8). I added JVM arrays and they are shown as “rawarray” in the charts. Finally, we get to the actual numbers.

Benchmark A

Click on chart for expanded version

There are some interesting data points here:

  1. Compressed references is a _huge_ win. RawArrayIndexed went from 500ms to 142ms and many of the vector operations were much faster.
  2. Escape analysis (which enables scalar replacement) doesn’t seem to have much of an effect.
  3. scalac -optimise doesn’t seem to have much of an effect.
  4. foreach is misleadingly fast in micro-benchmarks, but it’s easy to bring it down to earth. RawArrayForeach performs similarly to RawArrayIndexed, but RawArrayForeachMega is 10 times slower. The latter simply calls foreach with a few different anonymous functions during the collection creation phase causing the call site to become megamorphic. Once this happens, the only hope for good performance is that the foreach method gets inlined and it doesn’t seem to happen here. With this in mind, it seems like ticket 1338 (Optimize simple for loops) is a good idea.
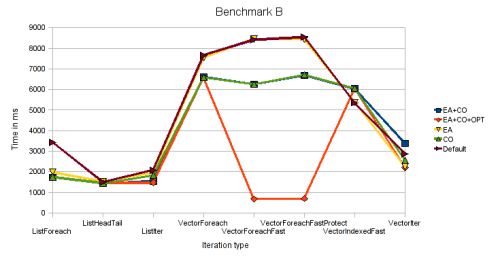
Benchmark B

Click on chart for expanded version

Once again, compressed references are a large factor in some benchmarks (halving the time taken in some cases).

The new bit of information is that scalac -optimise causes a huge improvement in VectorForeachFast and VectorForeachFastProtect. This makes sense once one considers one of the findings from the previous benchmark. We said that inlining of foreach is of extreme importance once a call site is megamorphic and this is precisely what -optimise does in this case (and the JVM fails to do so at runtime otherwise). Sadly, -optimise cannot do this safely in many cases as it’s shown by the results for VectorForeach.

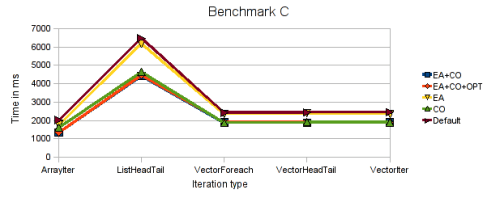
Benchmark C

Click on chart for expanded version

Once again, compressed references provide a nice boost. Seems like this option is a winner in 64-bit JVMs (if you don’t need a heap larger than 32GB), it saves memory and gives better performance. The usual disclaimer applies though, you should benchmark your own application instead of relying on micro-benchmarks when deciding what JVM options to use.

The complete results are also available. Feel free to play with the source code and provide your own numbers, fixes and/or improvements.

Advertisement

Load unsigned and better Compressed Oops Friday, Apr 3 2009 

The HotSpot engineers are constantly working on improving performance. I noticed two interesting commits recently:

Vladimir Kozlov improved Compressed Oops so that it doesn’t need to do encoding/decoding if the heap is smaller than 4GB and to reduce branches/checks if the heap is between 4GB and 32GB. The end result is that 64-bit now surpasses 32-bit performance in more situations. See my entry about Compressed Oops if you don’t know what I’m talking about. :)

Christian Thalinger added support for load unsigned in the -server JIT. This means that things like bytearray[i] & 0xFF and intarray[i] & 0xFFFFFFFF (necessary since JVM bytecode doesn’t support unsigned types) can be transformed into load unsigned operations to avoid the performance penalty. This can make a decent difference in some cases (e.g. charset operations).

32-bit or 64-bit JVM? How about a Hybrid? Tuesday, Oct 14 2008 

Before x86-64 came along, the decision on whether to use 32-bit or 64-bit mode for architectures that supported both was relatively simple: use 64-bit mode if the application requires the larger address space, 32-bit mode otherwise. After all, no point in reducing the amount of data that fits into the processor cache while increasing memory usage and bandwidth if the application doesn’t need the extra addressing space.

When it comes to x86-64, however, there’s also the fact that the number of named general-purpose registers has doubled from 8 to 16 in 64-bit mode. For CPU intensive apps, this may mean performance at the cost of extra memory usage. On the other hand, for memory intensive apps 32-bit mode might be better in if you manage to fit your application within the address space provided. Wouldn’t it be nice if there was a single JVM that would cover the common cases?

It turns out that the HotSpot engineers have been working on doing just that through a feature called Compressed oops. The benefits:

  • Heaps up to 32GB (instead of the theoretical 4GB in 32-bit that in practice is closer to 3GB)
  • 64-bit mode so we get to use the extra registers
  • Managed pointers (including Java references) are 32-bit so we don’t waste memory or cache space

The main disadvantage is that encoding and decoding is required to translate from/to native addresses. HotSpot tries to avoid these operations as much as possible and they are relatively cheap. The hope is that the extra registers give enough of a boost to offset the extra cost introduced by the encoding/decoding.

Compressed Oops have been included (but disabled by default) in the performance release JDK6u6p (requires you to fill a survey), so I decided to try it in an internal application and compare it with 64-bit mode and 32-bit mode.

The tested application has two phases, a single threaded one followed by a multi-threaded one. Both phases do a large amount of allocation so memory bandwidth is very important. All tests were done on a dual quad-core Xeon 5400 series with 10GB of RAM. I should note that a different JDK version had to be used for 32-bit mode (JDK6u10rc2) because there is no Linux x86 build of JDK6u6p. I chose the largest heap size that would allow the 32-bit JVM to run the benchmark to completion without crashing.

I started by running the application with a smaller dataset:

JDK6u10rc2 32-bit
Single-threaded phase: 6298ms
Multi-threaded phase (8 threads on 8 cores): 17043ms
Used Heap after full GC: 430MB
JVM Args: -XX:MaxPermSize=256m -Xms3328m -Xmx3328m -server -XX:+UseConcMarkSweepGC

JDK6u6p 64-bit with Compressed Oops
Single-threaded phase: 6345
Multi-threaded phase (8 threads on 8 cores): 16348
Used Heap after full GC: 500MB
JVM Args: -XX:MaxPermSize=256m -Xms3328m -Xmx3328m -server -XX:+UseConcMarkSweepGC -XX:+UseCompressedOops

The performance numbers are similar and the memory usage of the 64-bit JVM with Compressed Oops is 16% larger.

JDK6u6p 64-bit
Single-threaded phase: 6463
Multi-threaded phase (8 threads on 8 cores): 18778
Used Heap after full GC: 700MB
JVM Args: -XX:MaxPermSize=256m -Xms3328m -Xmx3328m -server -XX:+UseConcMarkSweepGC

The performance is again similar, but the memory usage of the 64-bit JVM is much higher, over 60% higher than the 32-bit JVM one.

Let’s try the larger dataset now:

JDK6u10rc2 32-bit
Single-threaded phase: 14188ms
Multi-threaded phase (8 threads on 8 cores): 73451ms
Used Heap after full GC: 1.25GB
JVM Args: -XX:MaxPermSize=256m -Xms3328m -Xmx3328m -server -XX:+UseConcMarkSweepGC

JDK6u6p 64-bit with CompressedOops
Single-threaded phase: 13742
Multi-threaded phase (8 threads on 8 cores): 76664ms
Used Heap after full GC: 1.45GB
JVM Args: -XX:MaxPermSize=256m -Xms3328m -Xmx3328m -server -XX:+UseConcMarkSweepGC -XX:+UseCompressedOops

The performance difference and memory overhead are the same as with the smaller dataset. The benefit of Compressed Oops here is that we still have plenty of headroom while the 32-bit JVM is getting closer to its limits. This may not be apparent from the heap size after a full GC, but during the multi-threaded phase the peak memory usage is quite a bit larger and the fact that the allocation rate is high does not help. This becomes more obvious when we look at the results for the 64-bit JVM.

JDK6u6p 64-bit
Single-threaded phase: 14610
Multi-threaded phase (8 threads on 8 cores): 104992
Used Heap after full GC: 2GB
JVM Args: -XX:MaxPermSize=256m -Xms4224m -Xmx4224m -server -XX:+UseConcMarkSweepGC

I had to increase the Xms/Xmx to 4224m for the application to run to completion. Even so, the performance of the multi-threaded phase took a substantial performance hit when compared to the other two JVM configurations. All in all, the 64-bit JVM without compressed oops does not do well here.

In conclusion, it seems that compressed oops is a feature with a lot of promise and it allows the 64-bit JVM to be competitive even in cases that favour the 32-bit JVM. It might be interesting to test applications with different characteristics to compare the results. It’s also worth mentioning that since this is a new feature, it’s possible that performance will improve further before it’s integrated into the normal JDK releases. As it is though, it already hits a sweet spot and if it weren’t for the potential for instability, I would be ready to ditch my 32-bit JVM.

Update: The early access release of JDK 6 Update 14 also contains this feature.
Update 2: This feature is enabled by default since JDK 6 Update 23.