Performance of FastMath from Commons Math Wednesday, Feb 23 2011 

Commons Math includes (in trunk and MATH_2_X branch) a FastMath class that is described as a “Faster, more accurate, portable alternative to StrictMath” and is implemented fully in Java (unlike java.lang.Math and java.lang.StrictMath). I am generally interested in faster math operations so I decided to investigate.

The first thing that I checked is if FastMath delegated to java.lang.Math or java.lang.StrictMath for any of its methods. It delegates to java.lang.Math for sqrt and random and to StrictMath for IEEEremainder. I found this interesting because I know that HotSpot includes intrinsic methods for many methods in java.lang.Math. Looking at vmSymbols.hpp, we can see that the following methods have intrinsics: abs, sin, cos, tan, atan2, sqrt, log, log10, pow, exp, min and max. Intrinsic methods are usually highly optimised (often involving assembly and sometimes CPU-specific instructions) and do not incur JNI overhead. I was interested in comparing all of FastMath’s methods with java.lang.Math and java.lang.StrictMath, but I was particularly interested in these ones.

Bill Rossi (the original author of FastMath) pointed me to a performance test in SVN, so I decided to run that (r1072209 from SVN trunk) on a Intel Core i7 CPU 860 2.80GHz using JDK 6 Update 25 early access release build 1 (includes HotSpot 20) and JDK 7 build 130 (includes HotSpot 21). I originally ran the test as it is in Commons Math with one addition but it has a few common micro-benchmarking mistakes (thanks to Aleksey for pointing them out in the comments). I fixed the issues (see here for the modified code) and ran the test again.

Since the relative results for the two JDKs did not differ much, I am only posting the charts for JDK 6 Update 25 early access release. The results for both JDKs are available in table form here. Note that the results are in milliseconds, so lower is better.

java.lang.Math does quite a bit better on tan, abs and log while FastMath does better on exp and cosh. The rest are similar.

FastMath does very well on hypot, pow, asin, acos, cbrt, sinh, tanh while java.lang.Math does well on log10 and log1p. java.lang.Math does so badly on hypot that it’s worth mentioning it again. Looks like it needs a bit of work.

As stated above, the results for JDK 7 are very similar with a few small improvements. Methods with an execution time reduction of 15% or higher were pow (202ms instead of 238ms), powII (125ms instead of 149ms) and atan (53ms instead of 66ms)

The usual disclaimers about benchmarks apply. The benchmark provided by commons-math is a good start, but I believe it should be fleshed out more so that common cases are measured separately (e.g. pow(x, 2) is much more common than the ones used in the test). Having said that, FastMath is a nice contribution and it seems like some methods in the JDK could be replaced by the ones in FastMath for better results. It also seems like FastMath could do better by delegating to the JDK for more of its methods.

Update: Some context for the contribution of FastMath to Apache Commons Math can be found here.

Update 2: I’ve updated the charts to use a modified test instead of the one in Commons Math as there were issues there. I had mentioned some suspicious scores, but thanks to Aleksey for pointing the issues out in the comments (they are common mistakes in micro-benchmarks).

Advertisement

New JVM options and Scala iteration performance Monday, Oct 26 2009 

Internal iterators like foreach tend to do very well in micro-benchmarks on the JVM. In fact, they often do as well as the equivalent manual while or for loop. There is a catch, however, and it’s easy to miss it in micro-benchmarks.

A few months ago, David MacIver forwarded an email from Martin Odersky to the scala-internals mailing list about this. The problem as described by Martin:

“The reason seems to be that the foreach itself is not inlined, so the call to the closure becomes megamorphic and therefore slow.”

I was curious about the benchmarks used to measure this and Tiark Rompf (who had performed the measurements) provided the source code. I said I’d try to take a look the next weekend and I did it… more than 3 months later. Well, better late than never. ;)

There are 3 benchmarks:

  • Benchmark A: traverse a collection with N elements
  • Benchmark B: traverse a collection with N elements, inside the loop/closure traverse another collection with N2 elements 3 times
  • Benchmark C: build a collection (front to back) of N elements

Various approaches are used for each benchmark with various collections types. One weakness of the these benchmarks is that they don’t include a verification mechanism to ensure that all benchmarks produce the same result. However, they include code that tries to prevent the JIT from performing unfair optimisations (e.g. print something if an element in the collection matches a certain condition).

The original results produced by Tiark can be found here.

I added a few benchmarks that use plain arrays (RawArrayIndexed, RawArrayForeach, RawArrayForeachMega), made minor changes to the scripts and pushed the code to a GitHub repository. I left the rest of the Scala code as it was to make it easy to compare with the original results and ran the benchmark with various JVM settings to see what effect they would have. All the tests shared the following:

  • Dual quad-core Xeon E5462 2.80GHz
  • 14 GB RAM
  • Fedora 11
  • Scala 2.8.0.r19261
  • Revision 59521431f5c118b73e35b0b396e3efd6aecec3dd of project
  • 64-bit JDK 6 Update 18 early access b03
  • JVM base settings: -Xms1G -Xmx1G -XX:+UseParallelGC -XX:+UseParallelOldGC

JDK 6 Update 18 is scheduled to be released on Q4, 2009 and it includes HotSpot 16. Even though JDK 6 Update 14 (HotSpot 14) introduced compressed references and scalar replacement, HotSpot 16 includes improved compressed references and many crucial fixes to both features. According to my testing these features are now approaching production-level stability and the OpenJDK engineers seem to agree as they are both enabled by default in HotSpot 17 (which will eventually hit JDK6 too).

Interested in how these features would affect the performance in these benchmarks, I ran them with various combinations. I also added Scala’s compiler -optimise flag in some cases.

The original benchmark from Tiark used 3 collection types: array (java.util.ArrayList), list (scala.List, immutable single linked list) and vector (earlier version of immutable vector that has recently been added to Scala 2.8). I added JVM arrays and they are shown as “rawarray” in the charts. Finally, we get to the actual numbers.

Benchmark A

Click on chart for expanded version

There are some interesting data points here:

  1. Compressed references is a _huge_ win. RawArrayIndexed went from 500ms to 142ms and many of the vector operations were much faster.
  2. Escape analysis (which enables scalar replacement) doesn’t seem to have much of an effect.
  3. scalac -optimise doesn’t seem to have much of an effect.
  4. foreach is misleadingly fast in micro-benchmarks, but it’s easy to bring it down to earth. RawArrayForeach performs similarly to RawArrayIndexed, but RawArrayForeachMega is 10 times slower. The latter simply calls foreach with a few different anonymous functions during the collection creation phase causing the call site to become megamorphic. Once this happens, the only hope for good performance is that the foreach method gets inlined and it doesn’t seem to happen here. With this in mind, it seems like ticket 1338 (Optimize simple for loops) is a good idea.
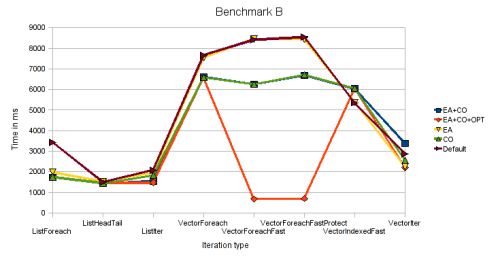
Benchmark B

Click on chart for expanded version

Once again, compressed references are a large factor in some benchmarks (halving the time taken in some cases).

The new bit of information is that scalac -optimise causes a huge improvement in VectorForeachFast and VectorForeachFastProtect. This makes sense once one considers one of the findings from the previous benchmark. We said that inlining of foreach is of extreme importance once a call site is megamorphic and this is precisely what -optimise does in this case (and the JVM fails to do so at runtime otherwise). Sadly, -optimise cannot do this safely in many cases as it’s shown by the results for VectorForeach.

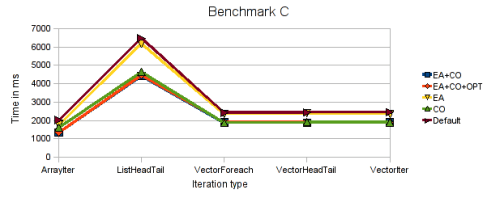
Benchmark C

Click on chart for expanded version

Once again, compressed references provide a nice boost. Seems like this option is a winner in 64-bit JVMs (if you don’t need a heap larger than 32GB), it saves memory and gives better performance. The usual disclaimer applies though, you should benchmark your own application instead of relying on micro-benchmarks when deciding what JVM options to use.

The complete results are also available. Feel free to play with the source code and provide your own numbers, fixes and/or improvements.

Load unsigned and better Compressed Oops Friday, Apr 3 2009 

The HotSpot engineers are constantly working on improving performance. I noticed two interesting commits recently:

Vladimir Kozlov improved Compressed Oops so that it doesn’t need to do encoding/decoding if the heap is smaller than 4GB and to reduce branches/checks if the heap is between 4GB and 32GB. The end result is that 64-bit now surpasses 32-bit performance in more situations. See my entry about Compressed Oops if you don’t know what I’m talking about. :)

Christian Thalinger added support for load unsigned in the -server JIT. This means that things like bytearray[i] & 0xFF and intarray[i] & 0xFFFFFFFF (necessary since JVM bytecode doesn’t support unsigned types) can be transformed into load unsigned operations to avoid the performance penalty. This can make a decent difference in some cases (e.g. charset operations).

Json serialization/deserialization faster than protocol buffers? Wednesday, Mar 25 2009 

I was reading the The Book of JOSH and saw the following statement:

“Json delivers on what XML promised. Simple to understand, effective data markup accessible and usable by human and computer alike. Serialization/Deserialization is on par with or faster then XML, Thrift and Protocol Buffers.”

That seemed a bit too definite for my taste. There are so many variables that can affect the results that I was interested in more information, so I asked for it and eventually got an answer.

I had a brief look at the benchmark referenced and that was enough to come up with some talking points. To make it easier to follow, I will just compare protocol buffers and json (jackson). I started by running the benchmark in my machine (java 1.6.0_14-ea-b03):

Object create Serialization Deserialization Serialized Size
protobuf 312.95730 3052.26500 2340.84600 217
json 182.64535 2284.88300 3362.31850 310

Ok, so json doesn’t seem to be faster on deserialization and the size is almost 50% bigger (a big deal if the network is the bottleneck as is often the case). Why is serialization of protobuf so slow though? Let’s see the code:

    public byte[] serialize(MediaContent content, ByteArrayOutputStream baos) throws IOException
    {
        content.writeTo(baos);
        return baos.toByteArray();
    }

How about we replace that with content.toByteArray()?

Object create Serialization Deserialization Serialized Size
protobuf 298.89330 2087.79800 2339.44450 217
json (jackson) 174.49190 2482.53350 3599.90800 310

That’s more like it. Let’s try something a bit more exotic just for fun and add XX:+DoEscapeAnalysis:

Object create Serialization Deserialization Serialized Size
protobuf 260.51330 1925.32300 2302.74250 217
json (jackson) 176.20370 2385.99750 3647.01700 310

That reduces some of the cost of object creation for protobuf, but it’s still substantially slower than json. This is not hard to believe because of the builder pattern employed by the Java classes generated by protocol buffers, but I haven’t investigated it in more detail. In any case, protocol buffers is better in 3 of the measures for this particular benchmark.

What does this mean? Not a lot. As usual, where performance is important, you should create benchmarks that mirror your application and environment. I just couldn’t let the blanket “json is on par with or faster than…” statement pass without a bit of scrutiny. ;)

Objects with no allocation overhead Wednesday, Dec 17 2008 

We have all heard about how HotSpot is really good at dealing with short-lived objects (both allocation and GC), but the truth is that object allocation is still pretty costly when compared to operations like addition or multiplication. Allocating an object for each step of an iteration over a large collection to make a simple computation might sound like the kind of thing no-one would ever do, but it’s actually quite common in languages like Scala (as described in a previous post). In Java-land, if you use the Function class from Google Collections with primitive wrappers, the same issue may occur. There are many JVM improvements that could help depending on the specific case (generic specialisation, value types, fixnums to name a few), but it’s unclear if/when we’ll get them.

So, what about that title? Escape analysis was introduced during Java 6, but the information gathered was only used for lock elision. However, this information can also be used for other interesting optimisations like scalar replacement and stack allocation. There have been doubts about the benefits of stack allocation (discussed in the comments) so the focus has been on scalar replacement so that the object is never in memory. At least that’s the theory.

Edward Lee started a couple of threads in the Hotspot-dev mailing list about scalar replacement here and here which reminded me to do some experiments. Note that this feature is still in development so the results posted here are preliminary and not indicative of how it will perform once it’s final. Still, it’s interesting to see how well it works at this time. I picked the latest JDK7 build (build 41) and ran a few tests with the following arguments passed to java “-XX:MaxPermSize=256m -Xms128m -Xmx3328m -server -XX:+UseConcMarkSweepGC” and either XX:-DoEscapeAnalysis or XX:+DoEscapeAnalysis.

I started by choosing the simplest test possible. Note that either testSimpleAllocation or testNoAllocation would be commented out.

class C(val a: Int, val b: Int)

object Test {
  def main(args: Array[String]) {
    for (i <- 1 to 10) testSimpleAllocation()
    //for (i <- 1 to 10) testNoAllocation()
  }
  
  def testSimpleAllocation() = {
    System.gc()
    var time = System.currentTimeMillis;
    var i = 0
    var sum = 0
    while (i < 1000000000) {
      sum += baz(new C(i + 1, i + 2))
      i += 1
    }
    println(sum)
    println(System.currentTimeMillis - time)
  }
  
  def testNoAllocation() = {
    System.gc()
    var time = System.currentTimeMillis;
    var i = 0
    var sum = 0
    while (i < 1000000000) {
      sum += baz(i + 1, i + 2)
      i += 1
    }
    println(sum)
    println(System.currentTimeMillis - time)
  }
  
  def baz(a: Int, b: Int): Int = a + b
  
  def baz(c: C): Int = c.a + c.b
}

The result were:


testNoAllocation: 403
testSimpleAllocation with EA: 1006
testSimpleAllocation without EA: 9190

As we can see, escape analysis has a tremendous effect and the method finishes in 11% of the time taken with it disabled. However, the version with no allocation is still substantially faster.

I decided to test a foreach method that takes a Function object next (this time in Java because it does less magic behind the scenes):

package test;

public class EscapeAnalysis {
  
  interface Function<T, R> {
    R apply(T value);
  }
  
  interface IntProcedure {
    void apply(int value);
  }
  
  static class BoxedArray {
    private final int[] array;
    
    public BoxedArray(int length) {
      array = new int[length];
    }
    
    public int length() {
      return array.length;
    }
    
    public void foreach(Function<Integer, Void> function) {
      for (int i : array)
        function.apply(new Integer(i));
    }
    
    public void foreach(IntFunction function) {
      for (int i : array)
        function.apply(i);
    }

    public void set(int index, int value) {
      array[index] = value;
    }

    public void foreachWithAutoboxing(Function<Integer, Void> function) {
      for (int i : array)
        function.apply(i);
    }
  }
  
  public static void main(String[] args) {
    BoxedArray array = new BoxedArray(100000000);
    /* We are careful not to restrict our ints to the ones in the Integer.valueOf cache */
    for (int i = 0; i < array.length(); i++)
      array.set(i, i);
    
    for (int i = 0; i < 10; i++)
      test(array);
  }

  private static void test(BoxedArray array) {
    System.gc();
    long time = System.currentTimeMillis();
    final int[] sum = new int[] { 0 };
    
    /* Uncomment the one that should be executed */
    testIntegerForeach(array, sum);
//    testIntegerForeachWithAutoboxing(array, sum);
//    testIntForeach(array, sum);

    System.out.println(System.currentTimeMillis() - time);
    System.out.println(sum[0]);
  }
  
  private static void testIntegerForeachWithAutoboxing(BoxedArray array, final int[] sum) {
    array.foreachWithAutoboxing(new Function<Integer, Void>() {
      public Void apply(Integer value) {
        sum[0] += value;
        return null;
      }
    });
  }
  
  private static void testIntegerForeach(BoxedArray array, final int[] sum) {
    array.foreach(new Function<Integer, Void>() {
      public Void apply(Integer value) {
        sum[0] += value;
        return null;
      }
    });
  }

  private static void testIntForeach(BoxedArray array, final int[] sum) {
    array.foreach(new IntFunction() {
      public void apply(int value) {
        sum[0] += value;
      }
    });
  }
}

The results were:


testIntForeach: 130
testIntegerForeachWithAutoboxing with EA: 1064
testIntegerForeach with EA: 224
testIntegerForeachWithAutoboxing without EA: 1039
testIntegerForeach without EA: 1024

This test shows something interesting, EA gives no improvement if Integer.valueOf (called by auto-boxing) is used instead of new Integer. Apart from that, the results are somewhat similar to the first ones (EA provides a substantial boost, but not enough to match the specialised implementation). After quickly testing that the boxing methods in ScalaRunTime had the same effect as Integer.valueOf, I decided that it was not worth testing more complex scenarios.

It seems like there’s a lot of potential for scalar replacement, but HotSpot needs to do a better job at detecting cases where it can be used safely. If nothing else, at least knowledge of the valueOf methods should be hardcoded into the system. I hope that a more general solution is found though because other languages on the JVM may use different methods (as mentioned earlier Scala uses methods in ScalaRunTime instead). It will also be interesting to see if the performance can get even closer to the no allocation case. Since the feature is still in development, we can hope. :)

Update: The early access release of JDK 6 Update 14 also contains this feature.
Update 2: This feature is enabled by default since JDK 6 Update 23.

Efficient Scala with Primitive Collections Monday, Sep 15 2008 

When dealing with large collections of primitives in Java/Scala, one can achieve substantial memory savings by using something like GNU Trove. Performance should also be better, but the difference may be small if the boxing does not happen in the performance-sensitive parts of the application. Using Trove is not as seamless as it should be because its collections don’t implement java.util interfaces (there are decorators, but they cause a lot of boxing defeating the purpose of using Trove in the first place). However, the advantages outweigh the disadvantages in some cases.

I wanted to use Trove collections from Scala conveniently without losing the efficiency benefits. Convenience in this case means the ability to pass anonymous functions to the usual suspects (i.e. map, flatMap, filter, etc.). One would ordinarily just write a wrapper, sprinkle some implicits and that would be it. Unfortunately, a naive wrapper will not meet the efficiency requirements.

Let’s start with the implementation that relies on an anonymous inner class to work out the baseline performance we’re aiming at. A simple implementation that serves the purpose is a method that sums all the elements of a TIntArrayList and returns it (preventing HotSpot from optimising it out).

  private def sumWithInnerClass(list: TIntArrayList): Int = {
    var sum = 0
    val p = new TIntProcedure() {
      def execute(i: Int) = {
        sum += i
        true
      }
    }
    list.forEach(p)
    sum
  }

This code is not much better than the Java equivalent (if at all), but it performs quite well. After a few iterations to allow the JVM to warm-up, it takes about 120ms to sum a list with 100 million items.

Let’s try a more convenient version of the code:

  implicit def toIntProcedureWithBoxing(f: Int => Unit): TIntProcedure = new TIntProcedure() {
    def execute(i: Int) = {
      f(i)
      true
    }
  }

  private def sumWithFunctionAndBoxing(list: TIntArrayList): Int = {
    var sum = 0
    list.forEach{x:Int => sum += x}
    sum
  }

We define an implicit from Int => Unit (which really means Function1[Int, Unit]) to a TIntProcedure and that allows us to pass an anonymous function to forEach. For the record, I am aware that a fold would have been a nicer way to define the sum (no need for the var), but I wanted to keep it similar to the initial version since I was interested in the performance difference caused by the wrapper. The results were certainly not encouraging, the boxing caused by calling Function1[Int, Unit] from TIntProcedure resulted in performance over 10 times worse: 1300ms on average.

That is not acceptable, so we need a way to avoid the boxing. Fortunately, the anonymous function for Function[Int, Unit] actually defines an apply(i: Int) method… but unfortunately we have no way to cast to the anonymous inner class generated by the Scala compiler, so we can’t invoke it. A possible solution is to generate traits like the following for the primitive types we care about and have the anonymous functions implement them when appropriate.

trait IntFunction[+R] extends Function1[Int, R] {
  def apply(i: Int): R
}

This gets more complicated once you consider that a function can take up to 22 parameters, but let’s for now assume that we only care about the case we use in our benchmark. I tried to think of ways to achieve this and it seemed like some compiler hacking was required. Given all my experience hacking compilers (read: none), I thought “why not?”.

To make my life easier, I decided not to read any documentation (not even sure if there’s any ;)) and settled for browsing and grep’ing the sources. Not too long after, I found what I was looking for, UncurryTransformer.tranform. After some analysis, it seemed like all that was needed was a conditional like:

        if (formals.head == IntClass.tpe && restpe == UnitClass.tpe) {
          anonClass setInfo ClassInfoType(
            List(ObjectClass.tpe, IntFunctionClass.tpe, fun.tpe, ScalaObjectClass.tpe), newScope, anonClass);
        }

Ok, I lie. I also defined IntFunctionClass in Definitions.scala. This is probably obvious, but I will mention it anyway, this is not a complete or general solution and it has a few limitations. However, it’s good enough to continue with the next part of the experiment. We can now define the following:

  implicit def toIntProcedure(f: Int => Unit): TIntProcedure = new TIntProcedure() {
    def execute(i: Int) = {
      f.asInstanceOf[IntFunction[_]](i)
      true
    }
  }
  
  private def sumWithFunction(list: TIntArrayList): Int = {
    var sum = 0
    list.forEach{x: Int => sum += x}
    sum
  }

We cast to IntFunction before calling apply, avoiding the boxing of the int. The performance for this was around 120ms to sum 100 million ints, which is about the same as the initial version. It seems like HotSpot does a very good job of inlining, so the additional indirection is basically free.

Ok, so the hack works. It’s relatively ugly, but at least the cast is encapsulated in the implicit converter and during normal usage, one does not have to deal with it. With more changes to the compiler, I believe it would be possible for Int => Unit to translate to IntFunction[Unit] or even IntUnitFunction instead of Function1[Int, Unit] and the cast would then not be needed. There are certainly some issues that would have to be worked out, but there are some nice performance benefits too.

It would solve issues like #1297 (where Range is 25 times slower than the while loop _after_ the fix) and mitigate #1338. It’s worth noting that work on scalar replacement through escape analysis in HotSpot and optimisation phases for the Scala compiler may reduce the amount of boxing that takes place, reducing the problem shown here. It’s unclear to what extent until we can try them out though.

The benchmark code can be found here. For my tests, I used JDK 6 Update 10 rc1 on an 8 core Mac Pro with the following options:

-XX:MaxPermSize=256m -Xms192m -Xmx2560m -server -XX:+UseConcMarkSweepGC

I think that’s enough for a first blog entry. Until next time. :)